Integrating D3.js visualizations in a React app
A small example exploring how to integrate D3.js data visualizations into a React app.
I've been working with D3.js and React lately, and in this post I wanted to share a few ways I found in building components and the interface between them. I think they help make both libraries work together quite nicely.
We'll be building a small example to illustrate this, and you can find the full code on GitHub, as well as a running version of the app. I'll also assume that you have some basic knowledge of React and D3.js.
Three simple guidelines
I think that using React and D3.js together makes sense because they share a common philosophy of "give me a set of data, tell me how it should be rendered, and I'll figure out which parts of the DOM to update for you". Indeed, React has its virtual DOM diffs, and D3.js has its update selections, making both quite efficient in the business of keeping the UI in sync with data changes.
I find that making D3 components play nice inside a React app becomes easier when you follow these simple guidelines:
(1) "One Source Of Truth": The D3 visualization should get all of the data it needs to render passed down to it. In this example, we'll see that the single source of truth is in the main <App> React component's state, and it is used by the D3 component (d3Chart) and other React components (for example <Stats>).
(2) "Stateless All The Things": This is related to (1). D3 and React components alike should be as stateless as possible, i.e. they shouldn't hide/encapsulate something that makes them render differently given the same "input". In this example, you'll notice that if you call d3Chart.update() at anytime with the same arguments, you always get the same result on screen.
(3) "Don't Make Too Many Assumptions": This is related to (1) and (2). Components shouldn't make too many assumptions about how they will be used. In this example, we'll see that d3Chart doesn't prescribe when tooltips should show, it only shows whatever it receives in the tooltips array. This allows us to show tooltips on hover, but also to easily create a "show/hide all tooltips" toggle.
Enough "theory", let's write some code.
A first basic chart
We'll call our D3.js chart component d3Chart. Let's define its public interface, which also represents its "lifecycle":
// d3Chart.js

var d3Chart = {};

d3Chart.create = function(el, props, state) {
  var svg = d3.select(el).append('svg')
      .attr('class', 'd3')
      .attr('width', props.width)
      .attr('height', props.height);

  svg.append('g')
      .attr('class', 'd3-points');

  this.update(el, state);
};

d3Chart.update = function(el, state) {
  // Re-compute the scales, and render the data points
  var scales = this._scales(el, state.domain);
  this._drawPoints(el, scales, state.data);
};

d3Chart.destroy = function(el) {
  // Any clean-up would go here
  // in this example there is nothing to do
};
Notice how the D3 component is completely stateless (guideline #2), i.e. it doesn't "hang on" to anything and gets everything it needs to render passed down to it from whatever code is using it. I find that doing this makes it easier to use in different contexts (in our case, we'll use it inside a React component).
The _drawPoints() function is your usual D3.js code with "enter", "update", and "exit" patterns:
// d3Chart.js

d3Chart._drawPoints = function(el, scales, data) {
  var g = d3.select(el).selectAll('.d3-points');

  var point = g.selectAll('.d3-point')
    .data(data, function(d) { return d.id; });

  // ENTER
  point.enter().append('circle')
      .attr('class', 'd3-point');

  // ENTER & UPDATE
  point.attr('cx', function(d) { return scales.x(d.x); })
      .attr('cy', function(d) { return scales.y(d.y); })
      .attr('r', function(d) { return scales.z(d.z); });

  // EXIT
  point.exit()
      .remove();
};
Now let's use this chart in a <Chart> React component:
// Chart.js

var d3Chart = require('./d3Chart');

var Chart = React.createClass({
  propTypes: {
    data: React.PropTypes.array,
    domain: React.PropTypes.object
  },

  componentDidMount: function() {
    var el = this.getDOMNode();
    d3Chart.create(el, {
      width: '100%',
      height: '300px'
    }, this.getChartState());
  },

  componentDidUpdate: function() {
    var el = this.getDOMNode();
    d3Chart.update(el, this.getChartState());
  },

  getChartState: function() {
    return {
      data: this.props.data,
      domain: this.props.domain
    };
  },

  componentWillUnmount: function() {
    var el = this.getDOMNode();
    d3Chart.destroy(el);
  },

  render: function() {
    return (
      <div className="Chart"></div>
    );
  }
});
Notice how we hook into React's lifecycle methods componentDidMount, componentDidUpdate, componentWillUnmount, which fit well with our D3 chart's create, update, destroy functions.
Finally let's create our main <App> React component, and use <Chart> to plot some data:
// App.js

var Chart = require('./Chart');

var sampleData = [
  {id: '5fbmzmtc', x: 7, y: 41, z: 6},
  {id: 's4f8phwm', x: 11, y: 45, z: 9},
  // ...
];

var App = React.createClass({
  getInitialState: function() {
    return {
      data: sampleData,
      domain: {x: [0, 30], y: [0, 100]}
    };
  },

  render: function() {
    return (
      <div className="App">
        <Chart
          data={this.state.data}
          domain={this.state.domain} />
      </div>
    );
  }
});

React.renderComponent(App(), document.body);
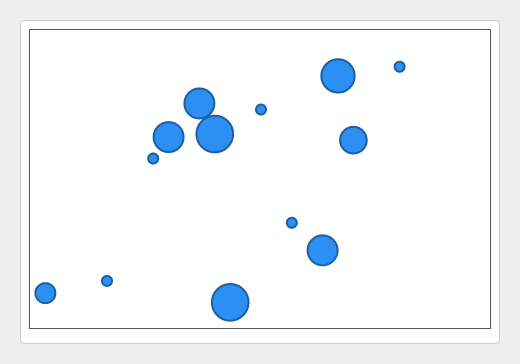
And behold! We have a pretty chart with circles:
Adding pagination and statistics widgets
At the top, we have our main <App> React component whose state is the "One Source Of Truth" (guideline #1). At the bottom, we have our d3Chart which is actually quite "dumb": you pass it an object with data and domain properties, and it just renders what it gets. These two things make it rather easy to add features.
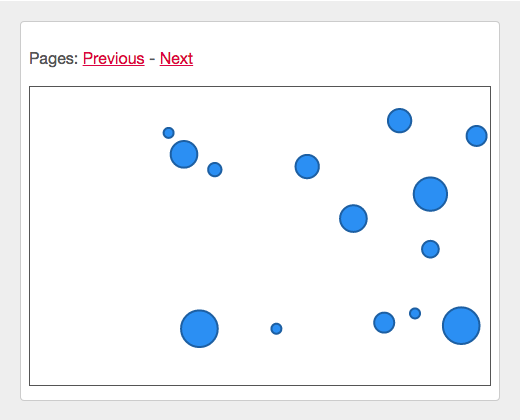
First, let's add some pagination controls which will allow us to explore a larger data set than we have room to display. We create a <Pagination> React component that will shift the domain and data displayed when the user clicks "Next" or "Previous":
// Pagination.js

var Pagination = React.createClass({
  propTypes: {
    domain: React.PropTypes.object,
    getData: React.PropTypes.func,
    setAppState: React.PropTypes.func
  },

  render: function() {
    return (
      <p>
        {'Pages: '}
        <a href="#" onClick={this.handlePrevious}>Previous</a>
        <span> - </span>
        <a href="#" onClick={this.handleNext}>Next</a>
      </p>
    );
  },

  handlePrevious: function(e) {
    e.preventDefault();
    this.shiftData(-20);
  },

  handleNext: function(e) {
    e.preventDefault();
    this.shiftData(+20);
  },

  shiftData: function(step) {
    var newDomain = _.cloneDeep(this.props.domain);
    newDomain.x = _.map(newDomain.x, function(x) {
      return x + step;
    });
    var newData = this.props.getData(newDomain);
    this.props.setAppState({
      data: newData,
      domain: newDomain
    });
  }
});
We update our main <App> component to support this new functionality:
// App.js

var Pagination = require('./Pagination');

var App = React.createClass({
  getInitialState: function() {
    var domain = [0, 30];
    return {
      data: this.getData(domain),
      domain: {x: domain, y: [0, 100]},
    };
  },

  _allData: [/* some big dataset, too much to display at once */],

  getData: function(domain) {
    return _.filter(this._allData, this.isInDomain.bind(null, domain));
  },

  isInDomain: function(domain, d) {
    return d.x >= domain[0] && d.x <= domain[1];
  },

  render: function() {
    return (
      <div className="App">
        <Pagination
          domain={this.domain}
          getData={this.getData}
          setAppState={this.setAppState} />
        <Chart
          data={this.state.data}
          domain={this.state.domain} />
      </div>
    );
  },

  setAppState: function(partialState, callback) {
    return this.setState(partialState, callback);
  }
});
That's it, we now have pagination! The <Pagination> component changes our "One Source Of Truth" through the convenience function setAppState(), which triggers a re-render and the new data and domain get passed down to the <Chart> component, causing d3Chart to display the correct "page" of data. If we wanted to remove the functionality, or use a different widget for it, all we need to do is remove or replace <Pagination ... /> in App.render().
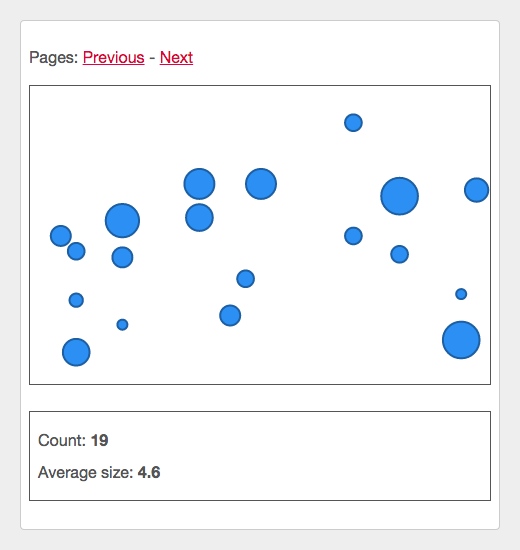
We can also do something else with App.state.data. For example, let's add a <Stats> widget that will show some fancy statistics on the data being displayed:
// Stats.js

var Stats = React.createClass({
  propTypes: {
    data: React.PropTypes.array
  },

  render: function() {
    var data = this.props.data;
    return (
      <div className="Stats">
        {this.renderCount(data)}
        {this.renderAverage(data)}
      </div>
    );
  },

  renderCount: function(data) {
    return (
      <div className="Stats-item">
        {'Count: '}<strong>{data.length}</strong>
      </div>
    );
  },

  renderAverage: function(data) {
    var avg;
    var n = data.length;
    if (!n) {
      avg = '-';
    }
    else {
      var sum = _.reduce(data, function(sum, d) {
        return sum + d.z;
      }, 0);
      avg = Math.round(sum/n * 10)/10;
    }
    return (
      <div className="Stats-item">
        {'Average size: '}<strong>{avg}</strong>
      </div>
    );
  }
});
And back in the main <App> component, all we need to do is drop in our new <Stats> component:
// App.js

var Stats = require('./Stats');

var App = React.createClass({
  // ...

  render: function() {
    return (
      <div className="App">
        <Pagination
          domain={this.domain}
          getData={this.getData}
          setAppState={this.setAppState} />
        <Chart
          data={this.state.data}
          domain={this.state.domain} />
        <Stats data={this.state.data} />
      </div>
    );
  }
});
Thanks to "One Source Of Truth", we know that the statistics shown always correspond to the data displayed on the D3.js chart.
Adding tooltips
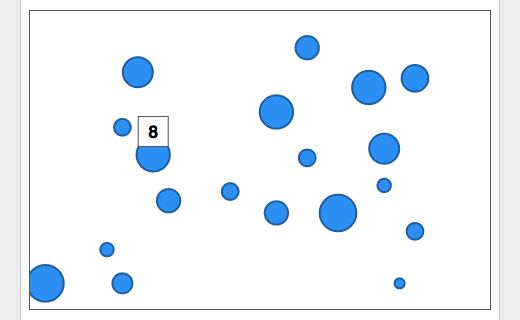
The last thing we'll add to this example are tooltips showing the number value (size) of each circle in the visualization.
We want a tooltip to appear when we hover the mouse over a circle. Since the D3 chart created the element corresponding to the circle, we need some way for d3Chart to "tell" its parents that a mouseover event happened on a circle. There are a couple ways we can do that. Here we'll just use a simple Node.js EventEmitter, that we'll call dispatcher:
// d3Chart.js

var EventEmitter = require('events').EventEmitter;

d3Chart.create = function(el, props, state) {
  // ...

  var dispatcher = new EventEmitter();
  this.update(el, state, dispatcher);

  return dispatcher;
};

d3Chart.update = function(el, state, dispatcher) {
  // ...
  this._drawPoints(el, scales, state.data, dispatcher);
};

d3Chart._drawPoints = function(el, scales, data, dispatcher) {
  // ...

  // ENTER & UPDATE
  point.attr('cx', function(d) { return scales.x(d.x); })
      .attr('cy', function(d) { return scales.y(d.y); })
      .attr('r', function(d) { return scales.z(d.z); });
      .on('mouseover', function(d) {
        dispatcher.emit('point:mouseover', d);
      })
      .on('mouseout', function(d) {
        dispatcher.emit('point:mouseout', d);
      });
  // ...
};
Notice that the d3Chart receives domain and data from "upstream", i.e. its parents <Chart> and <App>. I like to think of this as data flowing down. Using the dispatcher, we're able to send the mouseover and mouseout events and their associated data back "upstream". This is data flowing back up.
Now why go through all this trouble instead of just showing the tooltip right in d3Chart? Remember, we're trying to follow "Don't Make Too Many Assumptions" (guideline #3), and thus we don't want to assume that the code using d3Chart wants to show a tooltip when a circle gets hovered. We're just providing the information "hey, this circle was hovered".
Additionally, if we were to display a tooltip directly, we would introduce state in d3Chart, which goes against "Stateless All The Things" (guideline #2). Indeed, given the same domain and data, the chart could be rendered differently (whether a circle is hovered or not). The outside code would have no way to know what state the chart is rendered in, or any control over it.
So now that we have these mouse events flowing back up, let's do something with them. We add a tooltip object in our "One Source Of Truth":
// App.js

var App = React.createClass({
  getInitialState: function() {
    var domain = [0, 30];
    return {
      data: this.getData(domain),
      domain: {x: domain, y: [0, 100]},
      tooltip: null
    };
  },

  // ...
});
And in <Chart>, we listen to the dispatcher to update the tooltip object when a mouse event happens:
// Chart.js

var Chart = React.createClass({
  propTypes: {
    data: React.PropTypes.array,
    domain: React.PropTypes.object,
    setAppState: React.PropTypes.func
  },

  dispatcher: null,

  componentDidMount: function() {
    var el = this.getDOMNode();
    var dispatcher = d3Chart.create(el, {
      width: '100%',
      height: '300px'
    }, this.getChartState());

    dispatcher.on('point:mouseover', this.showTooltip);
    dispatcher.on('point:mouseout', this.hideTooltip);
    this.dispatcher = dispatcher;
  },

  componentDidUpdate: function(prevProps, prevState) {
    var el = this.getDOMNode();
    d3Chart.update(el, this.getChartState(), this.dispatcher);
  },

  // ...

  showTooltip: function(d) {
    this.props.setAppState({tooltip: d});
  },

  hideTooltip: function() {
    this.props.setAppState({tooltip: null});
  }
});
This is nice, but we're still not showing any tooltips. Let's add a tooltips array that gets passed to d3Chart.update(), as well as a function to draw the tooltips with D3:
// d3Chart.js

d3Chart.update = function(el, state, dispatcher) {
  // ...
  this._drawTooltips(el, scales, state.tooltips);
};

d3Chart._drawTooltips = function(el, scales, tooltips) {
  var g = d3.select(el).selectAll('.d3-tooltips');

  var tooltipRect = g.selectAll('.d3-tooltip-rect')
    .data(tooltips, function(d) { return d.id; });

  // ENTER
  tooltipRect.enter().append('rect')
      .attr('class', 'd3-tooltip-rect')
      .attr('width', TOOLTIP_WIDTH)
      .attr('height', TOOLTIP_HEIGHT);

  // ENTER & UPDATE
  tooltipRect.attr('y', function(d) { return scales.y(d.y) - scales.z(d.z)/2 - TOOLTIP_HEIGHT; })
      .attr('x', function(d) { return scales.x(d.x) - TOOLTIP_WIDTH/2; });

  // EXIT
  tooltipRect.exit()
      .remove();

  var tooltipText = g.selectAll('.d3-tooltip-text')
    .data(tooltips, function(d) { return d.id; });

  // ENTER
  tooltipText.enter().append('text')
      .attr('class', 'd3-tooltip-text')
      .attr('dy', '0.35em')
      .attr('text-anchor', 'middle')
      .text(function(d) { return d.z; });

  // ENTER & UPDATE
  tooltipText.attr('y', function(d) { return scales.y(d.y) - scales.z(d.z)/2 - TOOLTIP_HEIGHT/2; })
      .attr('x', function(d) { return scales.x(d.x); });

  // EXIT
  tooltipText.exit()
      .remove();
};
Notice another instance of "Don't Make Too Many Assumption". The D3 chart asks for a tooltips array (vs. a single tooltip object), because hey, who tells me you won't want to show more than one tooltip at once? (We'll actually see this come up in just a bit.)
Let's construct this tooltips array in <Chart> and pass it down with domain and data to the D3 chart:
// Chart.js

var Chart = React.createClass({
  propTypes: {
    data: React.PropTypes.array,
    domain: React.PropTypes.object,
    tooltip: React.PropTypes.object,
    setAppState: React.PropTypes.func
  },

  // ...

  componentDidUpdate: function(prevProps, prevState) {
    var el = this.getDOMNode();
    d3Chart.update(el, this.getChartState(), this.dispatcher);
  },

  getChartState: function() {
    return {
      data: this.props.data,
      domain: this.props.domain,
      tooltips: [this.props.tooltip]
    };
  },

  // ...
});
And voilà! We have tooltips on hover:
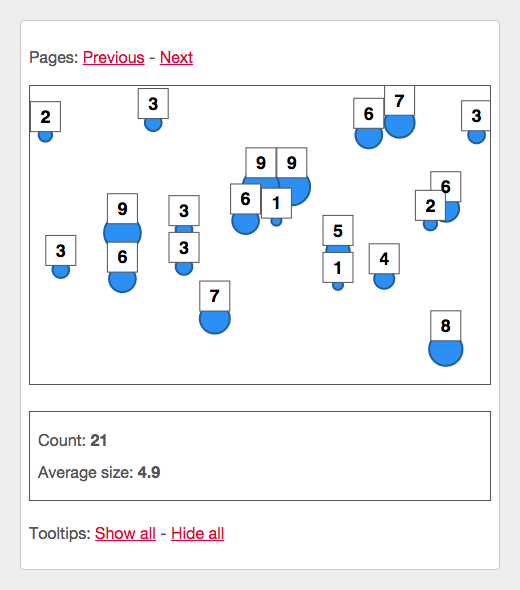
Now, let's see why we went through all this trouble of making things stateless and not making too many assumptions. Let's say we want to add a widget with buttons that allow you to "Show all" or "Hide all" tooltips. The way we have everything set up, it will be rather easy!
We add a boolean flag showingAllTooltips to our "One Source Of Truth":
// App.js

var App = React.createClass({
  getInitialState: function() {
    var domain = [0, 30];
    return {
      data: this.getData(domain),
      domain: {x: domain, y: [0, 100]},
      tooltip: null,
      showingAllTooltips: false
    };
  },

  // ...
});
We create a <ShowHideTooltips> React component that will toggle showingAllTooltips between true and false (the code for that widget isn't very interesting, so I won't show it here).
And finally we tweak the way we construct the tooltips array passed to our D3 chart in <Chart>:
// Chart.js

var Chart = React.createClass({
  propTypes: {
    data: React.PropTypes.array,
    domain: React.PropTypes.object,
    tooltip: React.PropTypes.object,
    showingAllTooltips: React.PropTypes.bool,
    setAppState: React.PropTypes.func
  },

  // ...

  getChartState: function() {
    var tooltips = [];
    if (this.props.showingAllTooltips) {
      tooltips = this.props.data;
    }
    else {
      tooltips = [this.props.tooltip];
    }

    return {
      data: this.props.data,
      domain: this.props.domain,
      tooltips: tooltips
    };
  },

  // ...
});
And there we go, with just a few lines of code we added a "show/hide all tooltips" functionality:
Conclusion
As a reminder, the full source code for this example is available on GitHub, as well as a running demo version. You'll notice that there are a few additional things, like an animation when you page back and forth (implement in a way that follows the 3 guidelines presented earlier). But to keep this post at a reasonable length, I decided not to cover it here.
I also want to point out that React allows you to work directly with SVG. Although I haven't used it much, I'm sure you could re-create most, if not all, of this example in "pure React". But here I assumed a scenario where you might already have some D3 components you want to re-use, and/or you would rather write the data visualization parts of your app in D3.
There are many ways to organize code in React and D3 (these are libraries that provide you with a set of tools, and don't really prescribe how you should use them). What I presented here is just one way, that I personally find easy to work with and reason about. I'm sure there are other great methods out there, so feel free to share your preferred React and D3 integration!